Industries such as aviation face a growing challenge: how to maintain complex equipment with minimal downtime, while efficiently scheduling the right technicians at the right time. Predictive Maintenance (PdM), combined with Technician Schedule Optimization, offers a solution to this challenge, and with the latest machine learning models and cloud deployment, businesses can implement this in real time.
In this article, we'll walk through how we use Python and cloud computing to deploy cutting-edge predictive maintenance models and schedule technicians based on real-time equipment health data and skill sets. We’ll include full code snippets that can be easily tested by any developer or enthusiast.
Why Predictive Maintenance?
Predictive maintenance relies on machine learning models to forecast equipment failure before it happens. This prevents costly unplanned downtime and allows businesses to act proactively.
To predict potential failures, we use models that rely on historical sensor data, such as:
- Temperature changes
- Vibration levels
- Pressure and wear readings
- Usage hours
Example: Using Prophet for Predictive Maintenance
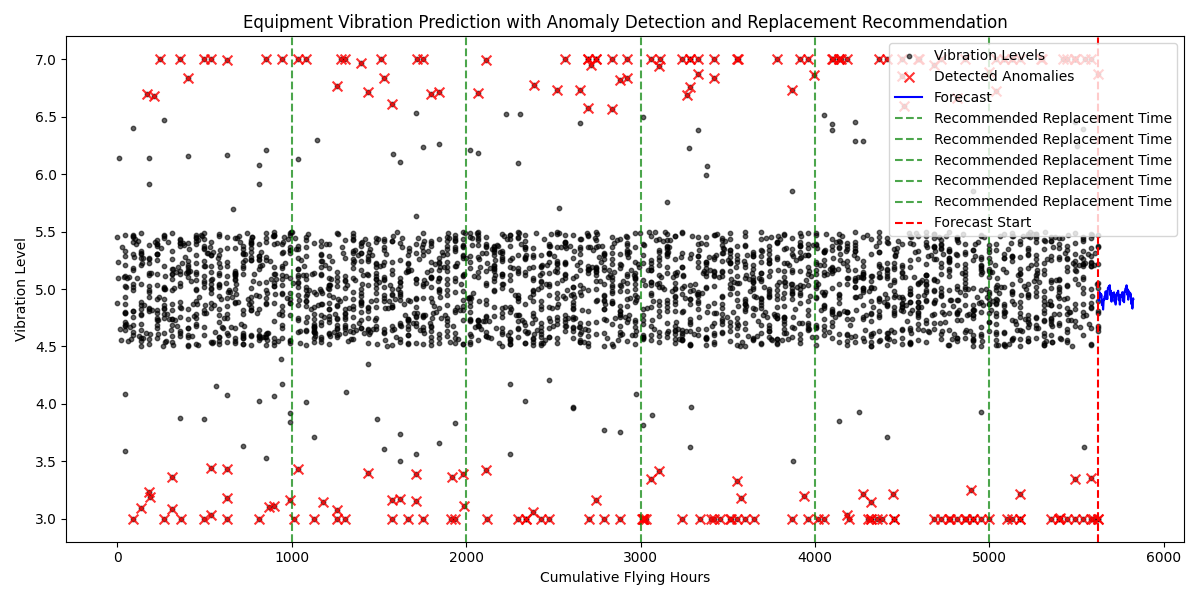
Let’s consider how we forecast equipment failure using Prophet, a powerful time series forecasting model by Facebook, on sensor data such as vibration levels.
Here’s a more complete Python example to get you started:
import pandas as pd
import numpy as np
from prophet import Prophet
import matplotlib.pyplot as plt
from datetime import timedelta

# Load historical sensor data with multiple features
try:
    data = pd.read_csv('sensor_data_with_anomalies.csv')
except FileNotFoundError:
    print("Error: 'sensor_data_with_anomalies.csv' file not found.")
    exit()

required_columns = ['timestamp', 'vibration_level', 'temperature', 'pressure', 'usage_hours', 'recommended_replacement_hours']
if not all(col in data.columns for col in required_columns):
    print(f"Error: Missing one or more required columns: {required_columns}")
    exit()

# Prepare the data for Prophet
data['ds'] = pd.to_datetime(data['timestamp'])
data['y'] = data['vibration_level']

# Simulate realistic flying hours based on LA-NY back and forth flight (one flight per day)
flight_hours_per_day = 10  # Assuming each round trip takes 10 hours
num_days = (data['ds'].max() - data['ds'].min()).days + 1
data['flying_hours'] = 0
for day in range(num_days):
    day_start = data['ds'].min() + timedelta(days=day)
    day_end = day_start + timedelta(hours=flight_hours_per_day)
    mask = (data['ds'] >= day_start) & (data['ds'] < day_end)
    data.loc[mask, 'flying_hours'] = (data.loc[mask, 'ds'] - day_start).dt.total_seconds() / 3600

# Calculate cumulative flying hours
data['cumulative_flying_hours'] = data['flying_hours'].cumsum()

# Detect anomalies using the Z-score method
z_scores = np.abs((data['y'] - data['y'].mean()) / data['y'].std())
anomalies = data[z_scores > 2.5]  # Threshold of 2.5 standard deviations for anomaly detection

# Create a new feature indicating if a data point is an anomaly
data['is_anomaly'] = 0
data.loc[anomalies.index, 'is_anomaly'] = 1

# Create a new feature indicating if part replacement is recommended, but reduce frequency
replacement_interval = data['recommended_replacement_hours'].iloc[0]  # Use the original replacement interval
data['needs_replacement'] = (data['cumulative_flying_hours'] >= replacement_interval).astype(int)

# Create Prophet model
model = Prophet(interval_width=0.95)
model.add_regressor('temperature')
model.add_regressor('pressure')
model.add_regressor('usage_hours')
model.add_regressor('is_anomaly')
model.add_regressor('needs_replacement')

# Fit the model
model.fit(data[['ds', 'y', 'temperature', 'pressure', 'usage_hours', 'is_anomaly', 'needs_replacement']])

# Create future DataFrame with 200 hourly periods (next 200 flying hours)
future = model.make_future_dataframe(periods=200, freq='h')
last_temp = data['temperature'].iloc[-1]
last_pressure = data['pressure'].iloc[-1]
last_usage_hours = data['usage_hours'].iloc[-1]
last_flying_hours = data['cumulative_flying_hours'].iloc[-1]
last_anomaly = data['is_anomaly'].iloc[-1]
last_needs_replacement = data['needs_replacement'].iloc[-1]

# Use the last known values for the regressors in the future DataFrame
future['temperature'] = last_temp
future['pressure'] = last_pressure
future['usage_hours'] = last_usage_hours
future['is_anomaly'] = last_anomaly
future['needs_replacement'] = last_needs_replacement

# Predict future values
forecast = model.predict(future)

# Plot the results with clear separation of historical, anomalies, and forecasted data
fig, ax = plt.subplots(figsize=(12, 6))

# Plot historical data
ax.scatter(data['cumulative_flying_hours'], data['y'], color='black', label='Vibration Levels', alpha=0.6, s=10)

# Plot anomalies
ax.scatter(data.loc[anomalies.index, 'cumulative_flying_hours'], anomalies['y'], color='red', label='Detected Anomalies', alpha=0.8, s=50, marker='x')

# Plot forecast data
future_flying_hours = np.arange(last_flying_hours + 1, last_flying_hours + 201)
ax.plot(future_flying_hours, forecast['yhat'][:200], color='blue', label='Forecast')

# Plot recommended replacement lines based on flying hours
replacement_dates = data.loc[data['needs_replacement'] == 1, 'cumulative_flying_hours'].unique()
replacement_dates = np.arange(1000, data['cumulative_flying_hours'].max(), 1000)  # Plot every 1000 cumulative flying hours
for replacement_date in replacement_dates:
    ax.axvline(x=replacement_date, color='green', linestyle='--', label='Recommended Replacement Time', alpha=0.7)

plt.axvline(x=last_flying_hours, color='red', linestyle='--', label='Forecast Start')  # Vertical line for forecast start
ax.set_title("Equipment Vibration Prediction with Anomaly Detection and Replacement Recommendation")
ax.set_xlabel("Cumulative Flying Hours")
ax.set_ylabel("Vibration Level")
ax.legend(loc='upper right')
plt.tight_layout()
plt.show()

In this code, we’ve used vibration data as the primary predictor of equipment failure, while adding additional features like temperature, pressure, and usage hours to improve prediction accuracy. You can easily extend this to include other types of sensor data based on your equipment’s setup.
Optimizing Technician Schedules Based on Skills
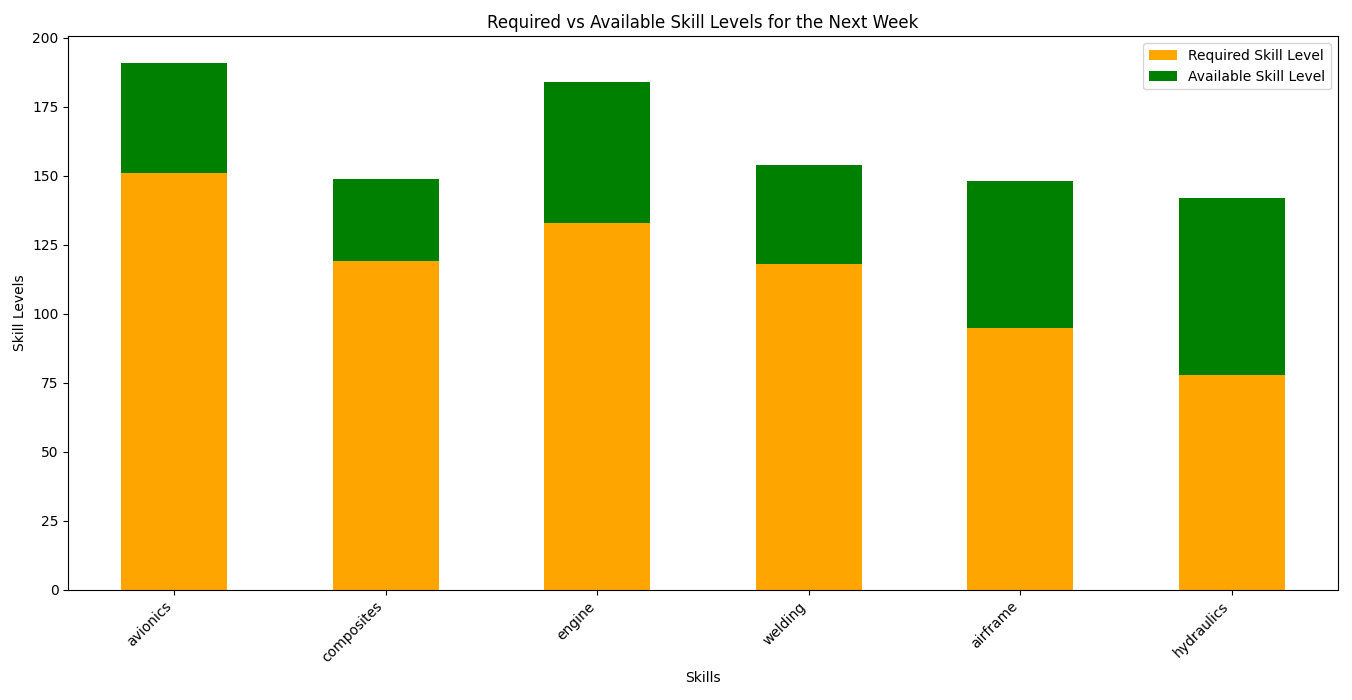
Technicians often have specific skills that are necessary for different maintenance tasks. This means that not only do we need to predict when maintenance will be needed, but we also need to assign the right technician with the right skills at the right time.
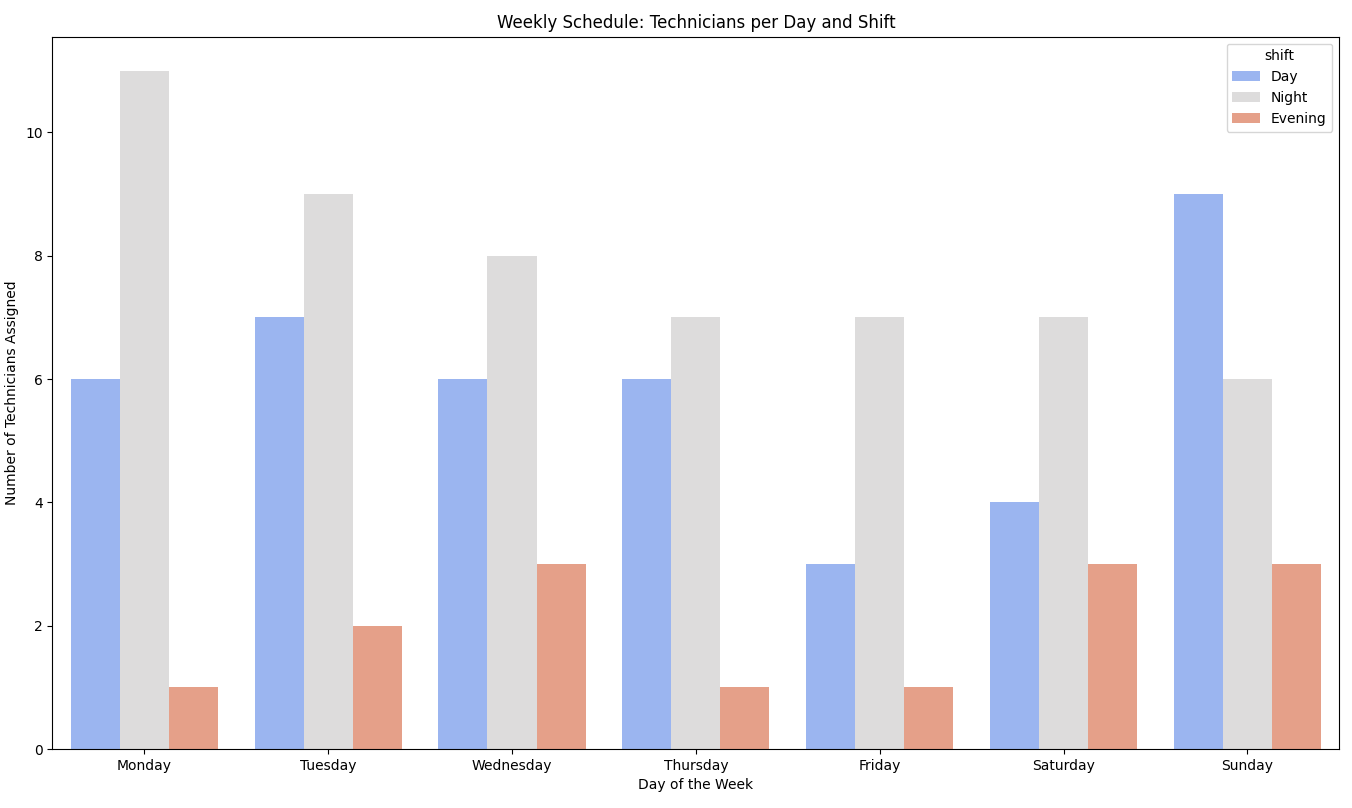
We use Mixed-Integer Linear Programming (MILP) to optimize technician schedules, factoring in technician availability and specific skill sets required for different maintenance tasks.
Here’s an updated Python example for technician scheduling:
import pulp
import pandas as pd
import numpy as np
from datetime import datetime, timedelta
import matplotlib.pyplot as plt
import seaborn as sns

# Load data from CSV files
print("Loading data from CSV files...")
technicians = pd.read_csv('technicians.csv')
tasks = pd.read_csv('tasks.csv')
completed_tasks = pd.read_csv('completed_tasks.csv')
upcoming_tasks = pd.read_csv('upcoming_tasks.csv')
print("Data loaded successfully.")

# Convert 'skills' and 'skill_levels' from strings to lists/dictionaries
print("Converting 'skills' and 'skill_levels' from strings...")
technicians['skills'] = technicians['skills'].apply(lambda x: x.split(','))
technicians['skill_levels'] = technicians['skill_levels'].apply(
    lambda x: {skill_level.split(':')[0]: int(skill_level.split(':')[1]) for skill_level in x.split(',')}
)
print("Conversion completed.")

# Define shift structure and working hours
shifts = ['Day', 'Evening', 'Night']
days_of_week = ['Monday', 'Tuesday', 'Wednesday', 'Thursday', 'Friday', 'Saturday', 'Sunday']

# Define shift lengths and effective work hours per shift considering breaks
shift_length = 8  # 8 hours per shift
lunch_break = 1  # 1-hour lunch break
short_breaks = 0.5  # Two 15-minute breaks
effective_shift_hours = shift_length - lunch_break - short_breaks  # 6.5 effective work hours per shift

# Add 'scheduled_date' column to upcoming_tasks if not already present
print("Adding 'scheduled_date' to upcoming tasks if not present...")
if 'scheduled_date' not in upcoming_tasks.columns:
    upcoming_tasks['scheduled_date'] = [datetime.now() + timedelta(days=np.random.randint(0, 7)) for _ in range(len(upcoming_tasks))]
print("'scheduled_date' added successfully.")

# Filter tasks for the upcoming week
print("Filtering tasks for the upcoming week...")
one_week_from_now = datetime.now() + timedelta(days=7)
upcoming_tasks['scheduled_date'] = pd.to_datetime(upcoming_tasks['scheduled_date'], errors='coerce')
upcoming_tasks = upcoming_tasks[upcoming_tasks['scheduled_date'] <= one_week_from_now]
print(f"Number of upcoming tasks: {len(upcoming_tasks)}")

# Only assign the upcoming tasks
tasks_to_assign = upcoming_tasks
print(f"Total tasks to assign: {len(tasks_to_assign)}")

# Prepare for visualization of skill gaps
print("Preparing skill gap analysis...")
required_skill_levels = tasks_to_assign.groupby('required_skill')['required_skill_level'].sum()
available_skill_levels = pd.Series(dtype=int)

# Calculate the available skill levels for each skill
for tech_levels in technicians['skill_levels']:
    for skill, level in tech_levels.items():
        if skill in available_skill_levels:
            available_skill_levels[skill] += level
        else:
            available_skill_levels[skill] = level

# Merge required and available skill levels into a single DataFrame
skill_gap_df = pd.DataFrame({'Required Skill Level': required_skill_levels, 'Available Skill Level': available_skill_levels}).fillna(0)
skill_gap_df['Skill Gap'] = skill_gap_df['Required Skill Level'] - skill_gap_df['Available Skill Level']
skill_gap_df = skill_gap_df.sort_values(by='Skill Gap', ascending=False)

# Plotting the skill gap
plt.figure(figsize=(12, 6))
sns.barplot(data=skill_gap_df.reset_index(), x='index', y='Skill Gap', palette='coolwarm')
plt.title('Skill Gaps for the Next Week\'s Tasks')
plt.xlabel('Skills')
plt.ylabel('Skill Gap (Demand - Availability)')
plt.xticks(rotation=45, ha='right')
plt.tight_layout()
plt.show()

# Detailed visualization of required vs. available skill levels
skill_gap_df[['Required Skill Level', 'Available Skill Level']].plot(
    kind='bar', figsize=(14, 7), stacked=True, color=['orange', 'green']
)
plt.title('Required vs Available Skill Levels for the Next Week')
plt.xlabel('Skills')
plt.ylabel('Skill Levels')
plt.xticks(rotation=45, ha='right')
plt.tight_layout()
plt.show()

# Highlight areas where skill gap is positive
if skill_gap_df['Skill Gap'].max() > 0:
    print("The following skills have unmet demand:")
    print(skill_gap_df[skill_gap_df['Skill Gap'] > 0])
else:
    print("No significant skill gaps detected.")

# Define the optimization problem
print("Defining the optimization problem...")
prob = pulp.LpProblem("Technician_Scheduling", pulp.LpMaximize)

# Create decision variables only for eligible combinations
print("Precomputing eligible technicians for each task...")
assignments = {}
eligible_techs_dict = {}

for t in tasks_to_assign['task_id']:
    task_row = tasks_to_assign[tasks_to_assign['task_id'] == t].iloc[0]
    required_skill = task_row['required_skill']
    required_skill_level = task_row['required_skill_level']

    eligible_techs = technicians[
        (technicians['skills'].apply(lambda skills: required_skill in skills)) &
        (technicians['availability'] == 1) &
        (technicians['skill_levels'].apply(lambda skill_levels: skill_levels.get(required_skill, 0) >= required_skill_level))
    ]['tech_id'].tolist()

    eligible_techs_dict[t] = eligible_techs

    # Create decision variables for eligible combinations of tasks and technicians
    for s in eligible_techs:
        for d in days_of_week:
            for shift in shifts:
                assignments[(t, s, d, shift)] = pulp.LpVariable(f"assign_{t}_{s}_{d}_{shift}", cat='Binary')

print(f"Total decision variables created: {len(assignments)}")

# Objective: Maximize the total number of assigned tasks
print("Setting the objective function to maximize the total number of assigned tasks...")
prob += pulp.lpSum(assignments[(t, s, d, shift)] for (t, s, d, shift) in assignments)

# Constraints: Each task should be assigned at most once
print("Adding constraints to assign tasks where possible...")
for t in tasks_to_assign['task_id']:
    prob += pulp.lpSum(assignments[(t_, s, d, shift)] for (t_, s, d, shift) in assignments if t_ == t) <= 1
print("Task assignment constraints added.")

# Constraints: Limit technician shifts per day
print("Adding constraints for technician shift limits per day...")
for s in technicians['tech_id']:
    for d in days_of_week:
        prob += pulp.lpSum(assignments[(t, s_, d, shift)] for (t, s_, d_, shift) in assignments if s_ == s and d_ == d) <= 1  # Allow 1 shift per day
print("Technician daily shift constraints added.")

# Constraints: Technician max hours per week
print("Adding constraints to ensure technicians do not exceed their maximum hours per week...")
for s in technicians['tech_id']:
    max_hours = technicians[technicians['tech_id'] == s]['max_hours'].iloc[0]  # Max hours for the week
    prob += pulp.lpSum(
        assignments[(t, s_, d, shift)] * effective_shift_hours
        for (t, s_, d, shift) in assignments if s_ == s
    ) <= max_hours
    print(f"Technician {s}: Max hours constraint added.")

# Solve the problem with a time limit
print("Solving the optimization problem with a 60-second time limit...")
result = prob.solve(pulp.PULP_CBC_CMD(timeLimit=60))  # 60-second time limit

# Check the result
print("Checking the result of the optimization...")
if pulp.LpStatus[prob.status] in ['Optimal', 'Not Solved', 'Undefined']:
    print("Solution found (may be suboptimal due to time limit).")

    # Create a weekly schedule
    weekly_schedule = []
    total_hours_assigned = 0
    total_break_hours = 0

    for (t, s, d, shift) in assignments:
        if pulp.value(assignments[(t, s, d, shift)]) == 1:
            task_details = tasks_to_assign[tasks_to_assign['task_id'] == t].iloc[0]
            tech_details = technicians[technicians['tech_id'] == s].iloc[0]

            weekly_schedule.append({
                'task_id': t,
                'task_skill': task_details['required_skill'],
                'task_level': task_details['required_skill_level'],
                'expected_duration': effective_shift_hours,
                'technician_id': s,
                'technician_name': tech_details['name'],
                'day': d,
                'shift': shift
            })

            # Update total hours and break hours
            total_hours_assigned += effective_shift_hours
            total_break_hours += lunch_break + short_breaks

    # Convert to DataFrame for visualization
    schedule_df = pd.DataFrame(weekly_schedule)

    # Ensure that the days of the week are ordered correctly
    schedule_df['day'] = pd.Categorical(schedule_df['day'], categories=days_of_week, ordered=True)

    # Plot the schedule if assignments are found
    if not schedule_df.empty:
        plt.figure(figsize=(16, 8))
        sns.countplot(data=schedule_df, x='day', hue='shift', palette='coolwarm')
        plt.title('Weekly Schedule: Technicians per Day and Shift')
        plt.xlabel('Day of the Week')
        plt.ylabel('Number of Technicians Assigned')
        plt.tight_layout()
        plt.show()
    else:
        print("No assignments made. The schedule DataFrame is empty.")

    # Calculate total available hours for all technicians
    total_available_hours = technicians['max_hours'].sum()

    # Print summary of total hours expected to be worked, total availability, and total breaks
    print("\nSummary:")
    print(f"Total Hours Assigned: {total_hours_assigned} hours")
    print(f"Total Available Hours: {total_available_hours} hours")
    print(f"Total Break Hours: {total_break_hours} hours")

else:
    print("Problem is infeasible or no feasible solution found within the time limit.")

# Print diagnostics for debugging
print("\nDiagnostics:")
print(f"Number of tasks to assign: {len(tasks_to_assign)}")
print(f"Number of technicians: {len(technicians)}")
for t, techs in eligible_techs_dict.items():
    print(f"Task {t} - Eligible technicians: {techs}")
    if len(techs) == 0:
        print(f"No technicians eligible for task {t}.")
Schedule Summary:
Total Hours Assigned: 715.0 hours
Total Available Hours: 779 hours
Total Break Hours: 165.0 hours

Diagnostics:
Number of tasks to assign: 200
Number of technicians: 20
Task 101 - Eligible technicians: [1, 2, 3, 4, 7, 8, 9, 12, 14, 17, 18]
Task 102 - Eligible technicians: [12, 13, 15, 20]
Task 103 - Eligible technicians: [4, 7, 8, 9, 18]
Task 104 - Eligible technicians: [1, 4, 8, 13, 20]
Task 105 - Eligible technicians: [4, 7, 8, 9, 18]
--------------------------------------------
Task 296 - Eligible technicians: [2, 5, 6, 7, 9, 11, 14, 15, 18, 20]
Task 297 - Eligible technicians: [3, 5, 6, 7, 8, 9, 10, 11, 13, 16, 18, 19]
Task 298 - Eligible technicians: [1, 2, 5, 6, 7, 9, 11, 14, 15, 16, 18, 19, 20]
Task 299 - Eligible technicians: [4, 7, 8, 9, 18]
Task 300 - Eligible technicians: [2, 3, 4, 5, 6, 7, 8, 9, 10, 11, 13, 15, 16, 17, 18, 19, 20]


This code ensures that:
- Each task is assigned to a technician who has the required skill.
- Technician availability, scheduled breaks and maximum working hours are respected.
- The schedule is optimized to minimize total work hours while accounting for urgency and skill requirements.
Deploying in the Cloud for Real-Time Results
Once your predictive maintenance models and technician schedule optimizations are ready, deploying them in the cloud allows you to act on real-time sensor data and technician availability updates instantly.
Here’s how you can deploy your models using AWS Lambda to predict equipment failures and optimize technician schedules as a cloud service:
import json
import boto3
import joblib
from prophet import Prophet
import pandas as pd

# Load the model (assuming it has been trained and serialized)
def load_model():
    try:
        # Load the pre-trained model from S3 or local storage
        model = joblib.load('/tmp/prophet_model.pkl')
    except FileNotFoundError:
        raise Exception("Model file not found. Make sure the path is correct and the model is properly saved.")
    return model

def lambda_handler(event, context):
    # Parse input (sensor data)
    try:
        new_data = json.loads(event['body'])
    except (KeyError, json.JSONDecodeError) as e:
        return {
            'statusCode': 400,
            'body': json.dumps({'error': 'Invalid input format', 'details': str(e)})
        }

    # Load the pre-trained predictive maintenance model
    try:
        model = load_model()
    except Exception as e:
        return {
            'statusCode': 500,
            'body': json.dumps({'error': 'Failed to load model', 'details': str(e)})
        }

    # Predict failure based on incoming sensor data
    try:
        new_sensor_df = pd.DataFrame(new_data)  # Convert to DataFrame for model

        # Ensure new_sensor_df has all required columns
        required_columns = ['ds', 'temperature', 'pressure', 'usage_hours', 'is_anomaly', 'needs_replacement']
        missing_columns = [col for col in required_columns if col not in new_sensor_df.columns]
        if missing_columns:
            return {
                'statusCode': 400,
                'body': json.dumps({'error': 'Missing required data fields', 'missing_fields': missing_columns})
            }

        # Predict using the Prophet model
        prediction = model.predict(new_sensor_df)

        # Extract relevant prediction information
        result = prediction[['ds', 'yhat', 'yhat_lower', 'yhat_upper']].to_dict(orient='records')

        return {
            'statusCode': 200,
            'body': json.dumps({'failure_prediction': result})
        }

    except Exception as e:
        return {
            'statusCode': 500,
            'body': json.dumps({'error': 'Prediction failed', 'details': str(e)})
        }
This function can be triggered automatically by AWS IoT or a data pipeline that processes sensor data in real time. It enables your system to predict equipment failures and trigger optimized technician schedules in response.
The Real-Time Advantage of Cloud-Based Predictive Maintenance
By deploying predictive models and technician schedule optimizations on cloud platforms like AWS, Google Cloud, or Azure, you unlock several key advantages:
- Instant Decision Making: Predict equipment failures and assign technicians in real time.
- Scalability: Cloud systems scale effortlessly to handle thousands of assets and technicians.
- Cost Efficiency: Only pay for the computing resources you use, reducing the overhead of on-premises servers.
- Minimized Downtime: Preemptive maintenance schedules can dramatically reduce unscheduled downtimes.
Conclusion
By using advanced machine learning models for predictive maintenance and skill-based technician scheduling, combined with the power of cloud computing, businesses can streamline operations, reduce costs, and enhance overall productivity. This approach not only predicts when and where maintenance is required but also ensures that the right technician is scheduled at the right time.
Try out the snippets and see how predictive maintenance can transform your business operations!
Would love to hear your thoughts on implementing this solution for your company—let's connect with!


